Water loss components expressed as percentages of system input value can result in seriously misleading perceptions of performance, progress and management of non-revenue water. NRW as percentage of system input volume just doesn’t work – it confuses, rather than informs perception.
What could be simpler that expressing non-revenue water (NRW) and its components, including Real Losses (leakage), as percentages of System Input Volume (SIV)? After all, it has been widely used for many years for setting targets, tracking progress and comparing performance. So why are water loss professionals increasingly abandoning percentages of SIV in favour of more ‘fit for purpose’ indicators? An international set of NRW percentages
An international set of NRW percentages
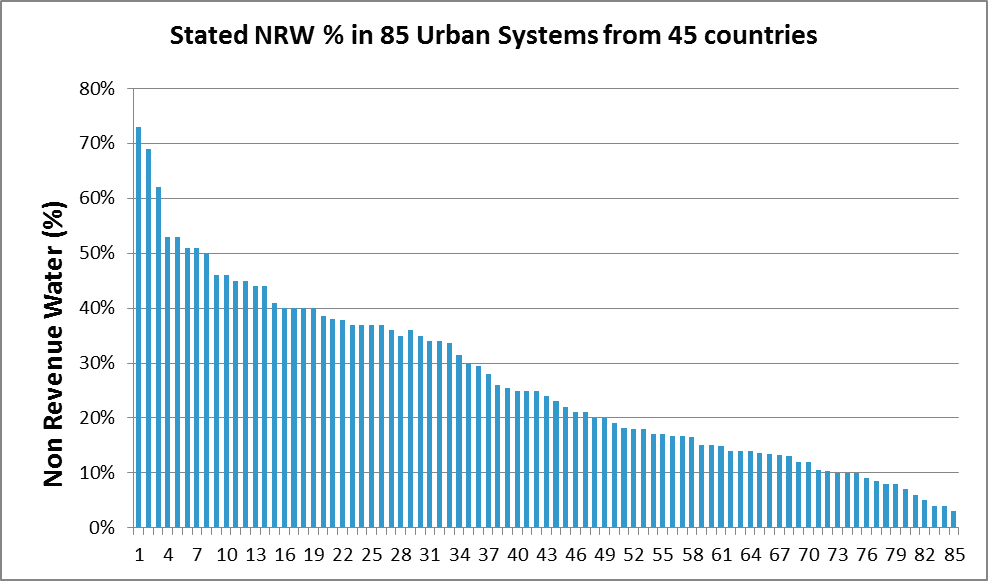
Figure 1: Source: Smart Water Networks Forum (SWAN) Survey, 2011
When you look at the NRW percentages in Figure 1, from 83 urban systems in 45 countries, ranging from 73 percent to 3 percent of SIV, it’s human nature to compare them, and begin to make value judgements about performance; perhaps even to think about setting arbitrary targets in percentage terms. However, the information you need to make meaningful judgements is not just incomplete, it’s absent. So don’t jump to conclusions; start to ask some key relevant questions, the answers may surprise you.
Which percentage of SIV has been reported? Does it include or exclude water exported?
Utilities can define SIV in several different ways; some use water abstracted, others treated water. System Input Volume may include or exclude water exported, which can be substantial in some systems, absent in others. Does an individual NRW calculated as a percentage of SIV include any water exported? You don’t even know from Figure 1 if a utility exports water or not. If a Utility’s NRW is 8 percent of SIV including exports, but 13 percent excluding exports, which figure did they choose to report? Did you realise that the ‘best’ Utility in Figure 1 (NRW of 3 percent of SIV) is a transmission utility exporting almost all of its water; that some systems in the data set have intermittent supply, and in some others customers have roof storage tanks which significantly increase the meter under-registration component of NRW?
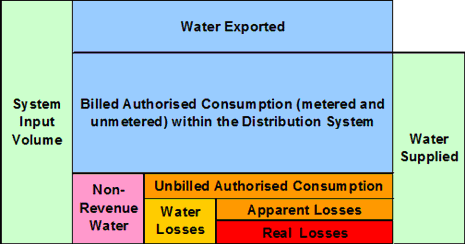
Figure 2: Simplified IWA Standard Water Balance
Are you mixing up Non-Revenue Water with Leakage?
Figure 2 shows that NRWconsists of several different components. Unbilled authorised consumption and apparent/commercial losses (customer meter under-registration and theft) are components of consumption which reach customers, but are not paid for. The remainder of NRW is Real Losses (leakage) from utility systems, some of which represents a potentially recoverable water resource.
Due to different meter locations on service connections, in some countries calculated leakage includes leakage on customers’ private underground pipes; in other countries it doesn’t. You don’t know which situation applies to each utility in Figure 1.
If setting targets to reduce leakage, you must first separate the NRW ‘unpaid consumption’ components (representing lost revenue) from the NRW leakage components (representing lost and potentially recoverable water). However, you don’t have that information in Figure 1, and unpaid consumption components of NRW can range from almost zero to almost half of the percentage NRW.
Percent of System Input Volume is a Zero-sum calculation. This term is well known in financial and commercial circles, but not in water loss control, where using NRW or Leakage as a percent of SIV for setting targets and tracking progress often has seriously misleading consequences. If you doubt this, set up and enter some figures in a simple Water Balance as in Table 1. You can use real or imaginary volumes of SIV and Consumption for year one and year two, then calculate NRW volume as (SIV – Consumption). Each of these volumes – SIV, Consumption and NRW – can change by different positive or negative percentages from year to year, as in the third column.
In contrast, whatever volumes you enter, the NRW and Consumption as percentages of SIV for year one and year two on the last two rows must always total 100 percent of SIV, so their percentages changes will always be equal and opposite (except when there is no change in water balance volumes from year to year, when they will both be 0 percent).
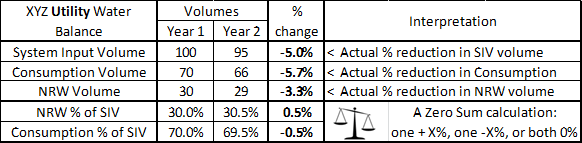
Table 1: Set up your own table and play the percentages game using your own data
Often NRW volume will reduce but NRW as a percentage of SIV will increase, as in the above example. If you increase consumption but don’t change NRW volume, NRW as percentage of SIV will decrease. Try increasing (or decreasing) both NRW and consumption volumes by the same percentage, and compare the results. Try other options, play the percentages game. Simple Zero Sum calculations such as Table 1 show why NRW (or leakage) as percent of SIV (or as percent of Water Supplied) is wholly unsuitable for setting targets or tracking progress.
NRW goes up – or down?
Modern demand management aims to reduce consumption and all components of NRW. However, and there are numerous international examples showing how expressing NRW as a percentage of SIV leads to misleading conclusions on progress. If you doubt this can happen, consider the following examples.
- Philadelphia, USA: 1993/2010: NRW volume fell by 39 percent, but NRW as percentage of SIV stayed at around 35 percent
- Yarra Valley Water, Australia: 2002/2010: NRW volume fell by 41 percent, NRW percentage SIV from 12 percent to 10 percent
- Zagreb, Serbia: 2012/2013: NRW volume fell by 6.3 percent, NRW percentage of SIV fell from 59.1 percent to 58.5 percent
- CASSA, Romania: 2007/2106: system size doubled, NRW volume fell by 13 percent, but NRW percentage of SIV from 49.3 percent to 48.3 percent.
Try to imagine how you would explain to a sceptical politician, regulator or media interviewer, during a drought or after a major investment program, that NRW volume and consumption has reduced substantially, but NRW percentage has hardly changed; or why NRW volume has reduced but NRW percentage of SIV has increased (or vice versa). NRW as percentage of SIV just doesn’t work – it confuses, rather than informs perception.
Comparing Management performance using % of SIV
Figure 3 provides a visual explanation of why percentage of SIV doesn’t work either for technical comparisons of leakage, which is the potentially recoverable water resource component of NRW.
Real losses calculated as a percentage of Water Supplied (Y-axis) vary with real losses in litres/connection/day (X-axis) and total consumption in litres/connection/day (curved lines). Water Supplied is used for this graph, rather than SIV, to eliminate the distorting influence of Water Exported.
If, for example, real losses are 200 litres/connection/day, this could represent a Real Loss perecentage of any figure between 5 percent of for a metropolitan area with 4000 litres/conn/day consumption) to 40 percent for a low consumption area with 300 lit/conn/day consumption; is that a fair basis for comparison of performance? A similar graph can be created for leakage and consumption in volume/km mains/day.
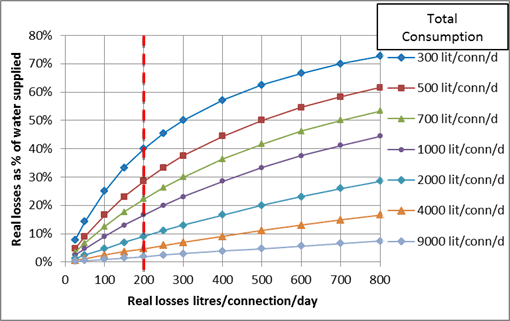
Figure 3: How differences in consumption influence Real Losses as a % of Water Supplied
Why can’t every system achieve the same percentage of leakage?
Figure 3 also shows that, to achieve real losses of (say) 10 percent of water supplied, a low consumption system would need to achieve 30 litres/connection/day real losses, but a metropolitan system could reach the 10 percent target with 450 litres/connection/day real losses – 15 times the leakage of the low consumption system.
Then there are also the differing physical characteristics of systems to take into account. Leak flow rates vary roughly linearly with average system pressure; leakage volume also increases with higher density of connections (per km of mains) and greater average length of service connections (main to meter).
Context matters!
In 2010, an Asian metropolitan city claimed to have real losses close to 1 percent of SIV. Australian Water Services Association stopped using percentages of SIV in 2003. Rather than seeking consumption, pressure and other context information, everyone simply took the percentage figure at face value; that is a basic problem with percentage of SIV. In the State of Victoria, where the Regulator continued to use percentages, a utility which had achieved 9 percent real losses, after much effort throughout the millennium drought, questioned how any utility could achieve 1 percent. A simple comparison of context information showed that the Australian Utility operated at 2.1 times the average pressure, and 27 percent of the consumption per connection, of the Asian utility. Simulating quadrupling of consumption and halving of average system pressure – not feasible, sensible or practical options – the Australian Utility could also achieve close to 1 percent.
However, when the two utilities’ real losses were compared using the IWA performance indicator designed for technical comparisons of Real Losses – Infrastructure Leakage Index ILI published in 1999 – they were found to be both operating with real losses almost equal to their unavoidable (technical minimum) annual real losses (UARL), taking into account their individual distribution system parameters and operating pressures, with ILIs close to 1.0. Table 2 shows why the ILI is currently the only ‘fit for purpose’ performance indicator purposely designed for comparing technical performance in management of Real Losses.
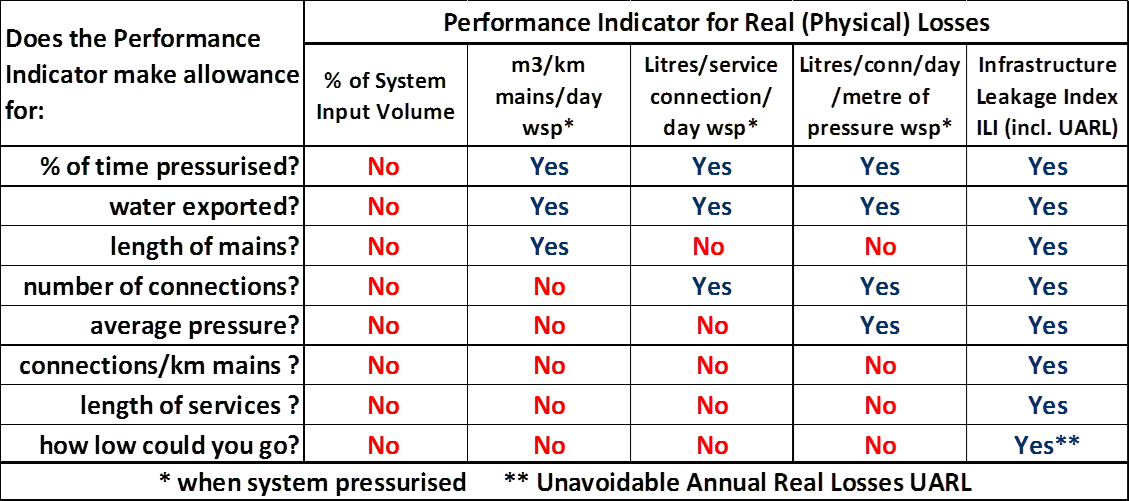
Table 2: Why ILI is the best ‘Fit for Purpose’ KPI for technical comparisons of real losses
EU reference document: ”Good Practices on Leakage Management”
The recommendations for ‘Fit for Purpose’ KPIs for Real Losses in this 2015 Document are summarised in Table 3. Four KPIs are considered suitable for setting targets and tracking performance in individual systems; percentage of SIV and percentage of water supplied are explicitly rejected.
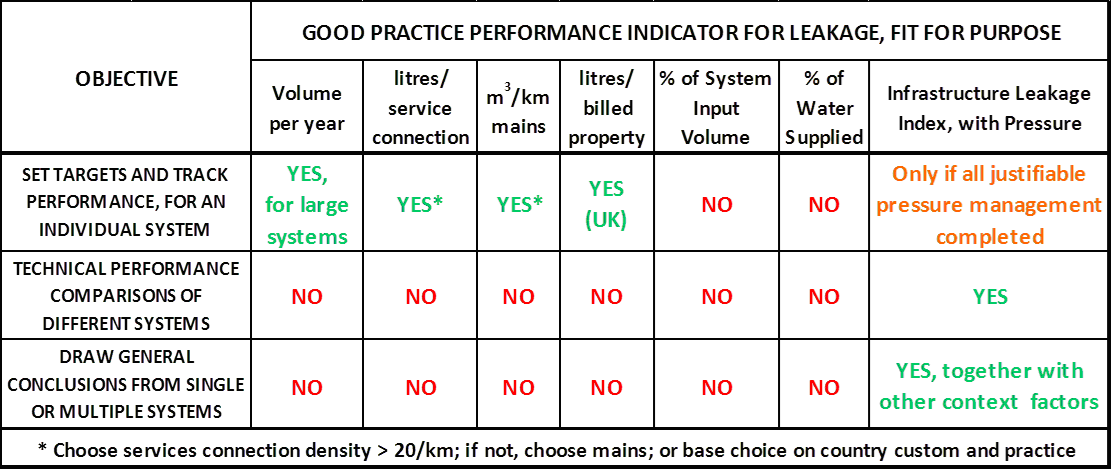
Table 3: Fit for Purpose Key Performance Indicators for Real Losses.
Table 3 shows that ILI can also be used with other context factors for drawing general conclusions regarding strengths and weaknesses of real losses management in individual systems.
What is the IWA Position on NRW as a percentage of SIV?
At the IWA Performance Indicators Conference (May 2017) in Vienna, it was stated that “Everyone knows percentages of SIV must not be used for target-setting and/or making technical comparisons”. Nevertheless, the 3rd Edition of the IWA Manual of Best Practice: Performance Indicators for Water Supply Services (2017) continues to recommend NRW percent of SIV, as a financial/economic performance indicator, even though this in itself contains no financial information or valuation of components of NRW. The accompanying comment that this is “perhaps the most popular and easy way to assess water losses” shows very clearly how slow some parts of the water industry have been to adapt to necessary change, when they still favour a performance indicator that is clearly not fit for purpose, simply because it is traditional and easy to calculate, rather than rational and meaningful in application.
A basic requirement for Performance Indicators specified elsewhere in the Manual is that: “The use of denominators of variables which may vary substantially from one year to another, particularly if not under the control of the Utility, should be avoided (e.g., annual consumption, that may be affected by other external reasons) unless the numerator varies in the same proportion. A rule of thumb is that the denominator should be a cause of change in the numerator.”
NRW as a percent of SIV actually fails to meet this basic requirement because consumption accounts for the major part of SIV, leakage accounts for the major part of NRW, and consumption and NRW are a Zero Sum calculation. Hopefully NRW as a percent of SIV will not appear in the 4th Edition several years from now.
Time for a change: professionals abandon percentages of SIV initiative
Water management professionals have been increasingly aware of these problems for years, and some countries have already abandoned percentages of SIV. However, the problem is still not widely recognised outside the specialist water loss community. Water resources management in this century is too important to be managed using outdated and misleading tools. After reading this article, if you agree that action is needed, you may wish to show your support by joining the Professionals abandon Percentages initiative on the LEAKSSuite website.
To quote American journalist Henry Mencken: “For every complex problem there is a solution which is simple, neat and wrong.” For water loss management, NRW as percentage of System Input Volume is exactly that.
Author’s note: Allan Lambert is an IWA Fellow and founder of the Open Access LEAKSSuite website. Thanks to colleagues Marco Fantozzi, Cor Merks and Mark Shepherd for their contributions to this article, and to more than 140 other colleagues from 26 countries for their ongoing support for the Professionals abandon Percentages initiative. For more information on this topic see Pros Abandon Percents of SIV
This article was written for, and appeared in, the November 2017 Issue of Water and Wastewater International Journal.