2022 ILI data for Quebec Province
This 2022 dataset of ILIs from municipalities in Quebec Province, Canada was obtained from annual data collected by the Quebec Water Efficiency Strategy team. Our sincere thanks to Hugo Labrosse and Guillaume Dabate at Ministère des Affaires municipales et de l’Habitation (MAMH) for their kind assistance.
Water Audit data in Quebec Province from 655 municipalities based on validated data, including systematically calculated average pressures, were used to calculate ILI values using the 1999 UARL equation (UARL1999) developed by the 1st IWA Water Loss Task Force for systems with more than 5000 service connections at mid-range pressures around 50 metres. International ILI data since then confirms that the UARL1999 equation is likely to be generally valid to within +/-10% for systems with more than 5000 service connections and average pressures in the range of 45-60m.
Outside these boundary conditions, research since 1999 has shown that UARL1999 annual volumes for individual systems can now be customised to local system parameters using System Correction Factor (SCF) software which includes:
- presssure:leak flow rate relationships using Fixed and Variable Area Discharges (FAVAD) concepts based on % of rigid and flexible pipe materials, rather than the simplified linear relationship (Power Law N1 = 1) used in UARL1999
- median annual (rather than average annual) burst frequencies for smaller systems
- pressure:burst frequency relationships, not known or included in UARL1999
As 90% of Quebec Province municipalities have fewer than 5000 service connections. and 50% of municipalities have average pressures outside the 45 to 60 metres range (one-third below 45 metres and one-sixth above 60 metres), MAMH became the first international State or Province to calculate and compare UARL1999 and UARL with SCF for every municipality, to predict UARLs less than 0.9 in small systems, improve data quality checks and prioritise targets for further leakage reduction.
Results presented here, and conclusions, are summarised at the end of this page.
Overall ILI and pressure data across 655 municipalities
The graph below shows the ranges of ILIs and reported Average Pressures (in metres) for 655 municipalities. Some municipalities have more than one water distribution network, making a total of 784 ILI results. The green band shows those Average Pressures between 45-60m which are suitable for a UARL 1999 calculation.
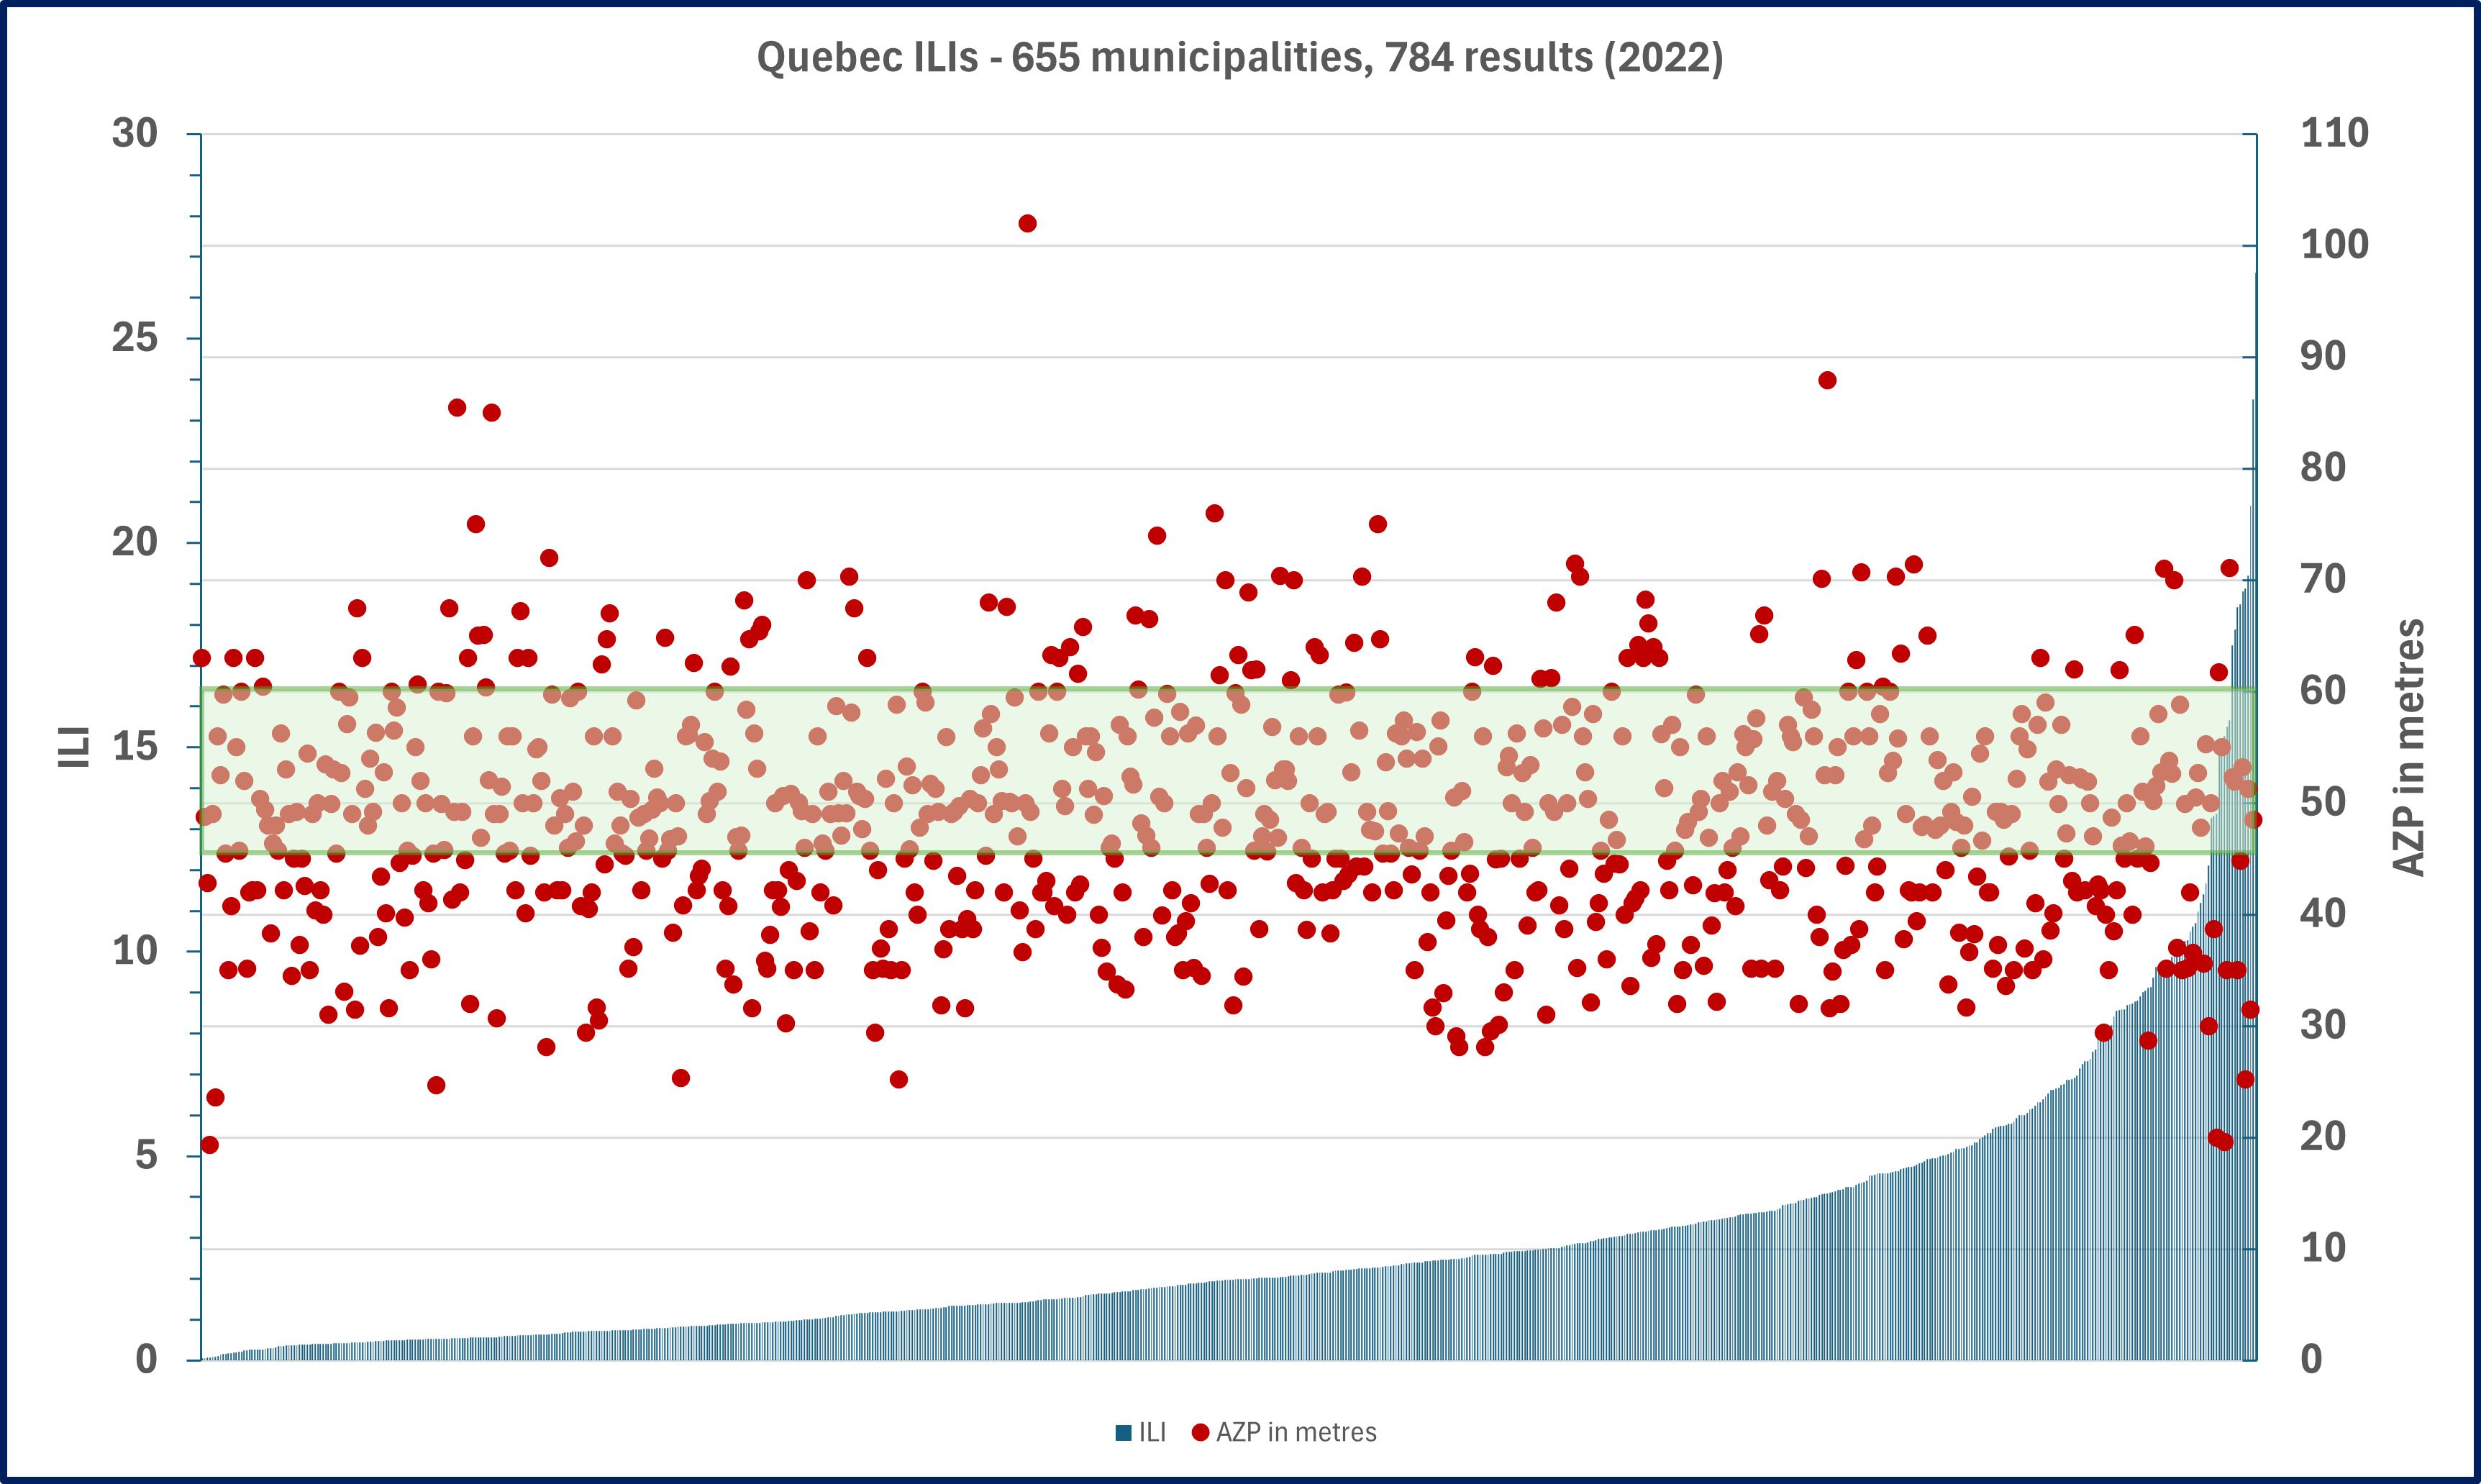
By itself, the graph above is not particularly insightful, due to the many hundreds of municipalities and the large range of ILI values for this dataset, ranging from 0.1-26.6.
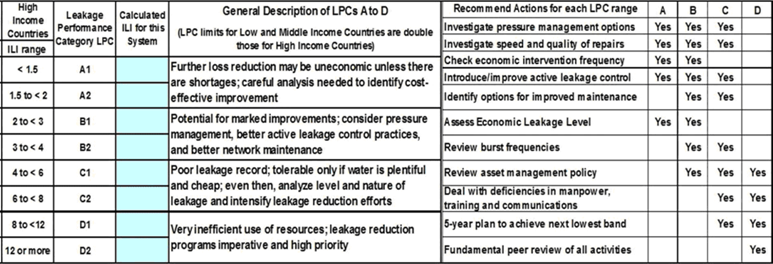
For clearer analysis, this dataset is further broken down and classified using international Leakage Performance Categories A1 to D2 shown below and also in ‘UARL and ILI‘ section of the LeaksSuite Library website.
ILI and Average Pressures in LPCs A1 and A2 – ILI<2
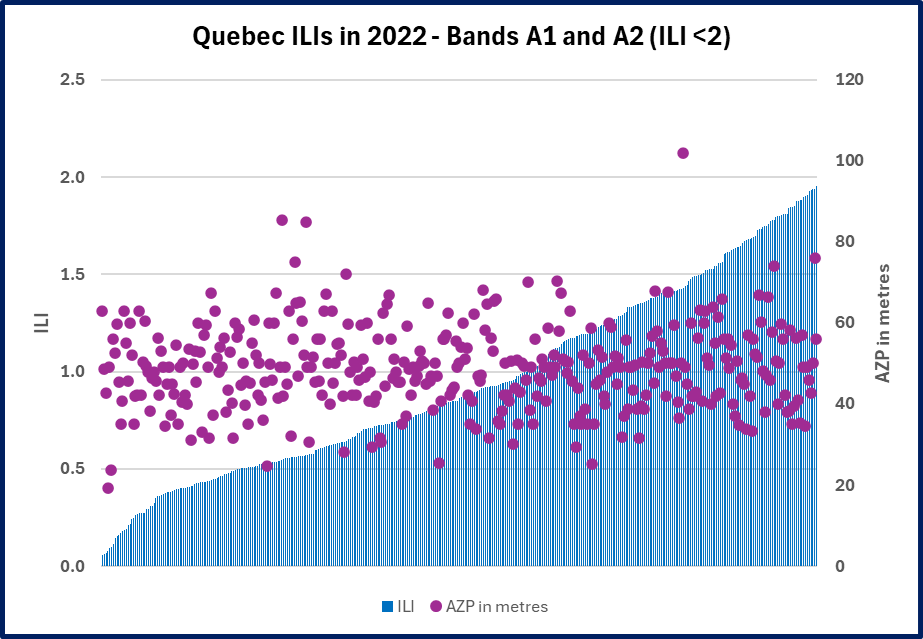
- 388 municipalities (49.2%) reported ILIs of < 2
- Average Pressure ranged from 19-102 metres
- Further investigation of some of these results advised, as 64 municipalities reported ILIs of <0.5
- ILIs are influenced by system size (number of service connections) and Average Pressure.
- Typically, small systems operating at <45m Average Pressure report low ILIs
- In this ILI group, system size ranges from 5 – 25000 connections
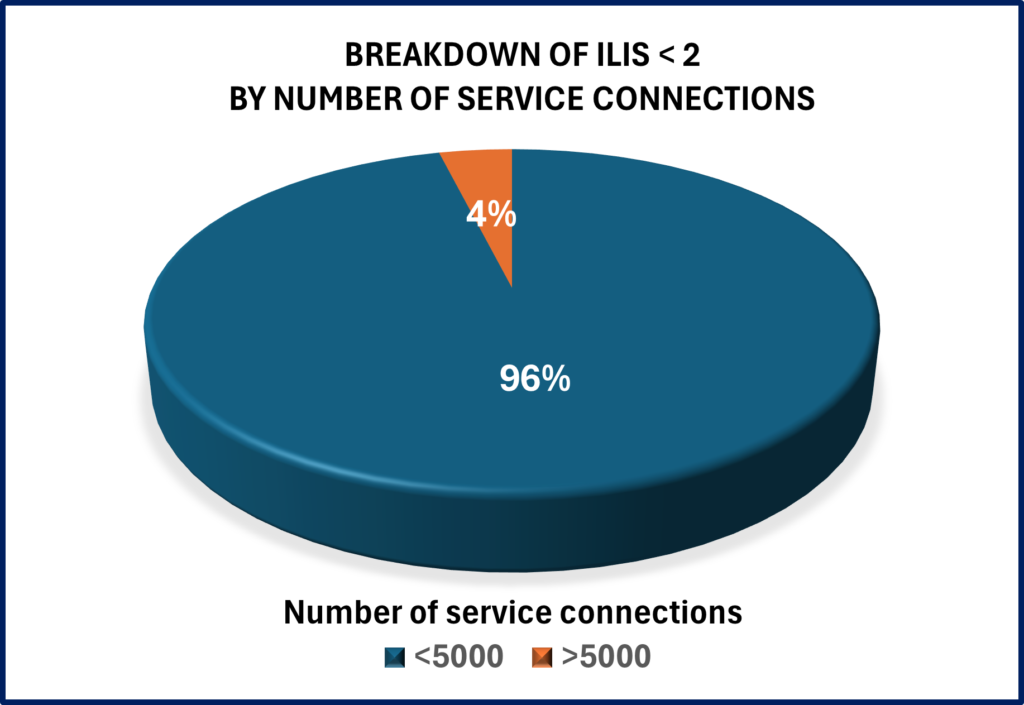
- In this ILI group, 96% of municipalities reporting ILIs <2 were small systems with <5000 service connections
- Only 4% of municipalities reporting ILIs of <2 had more than 5000 service connections
- Average Pressure ranged from 19-102 metres
- Typically small systems operating at <45m Average Pressure report low ILIs
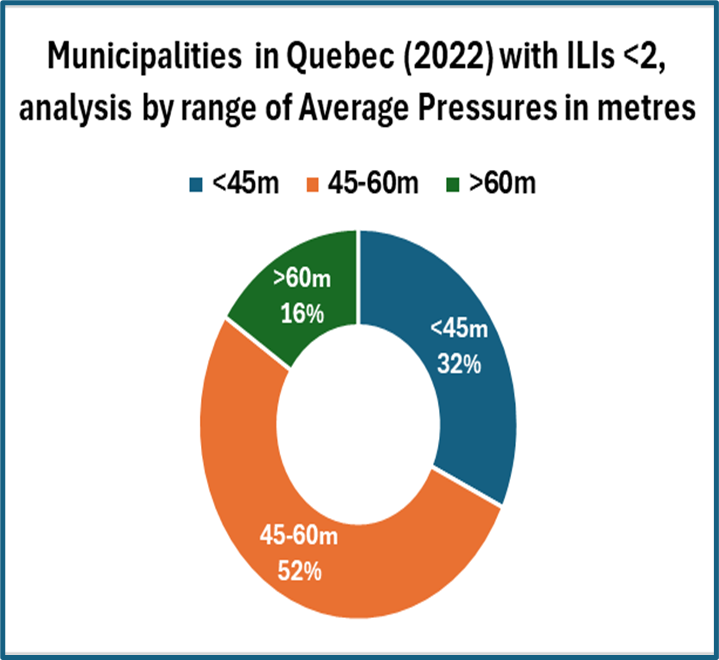
- For this dataset, 32% of municipalities reporting ILIs <2 operate at Average Pressures below 45m, 52% between 45-60m and 16 % above 60m Average Pressure
ILI and Average Pressures in LPCs B1 and B2 – ILI 2-4
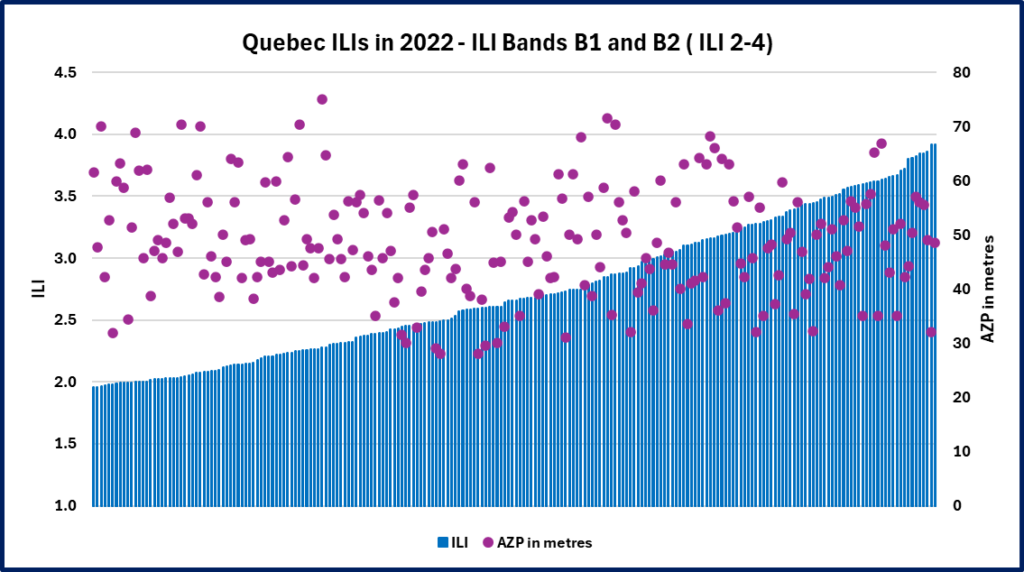
- 224 municipalities (28.4%) reported ILIs between 2-4
- Average Pressure ranged from 28-75 metres
- In this ILI group, system size ranges from 35 – 175000 connections
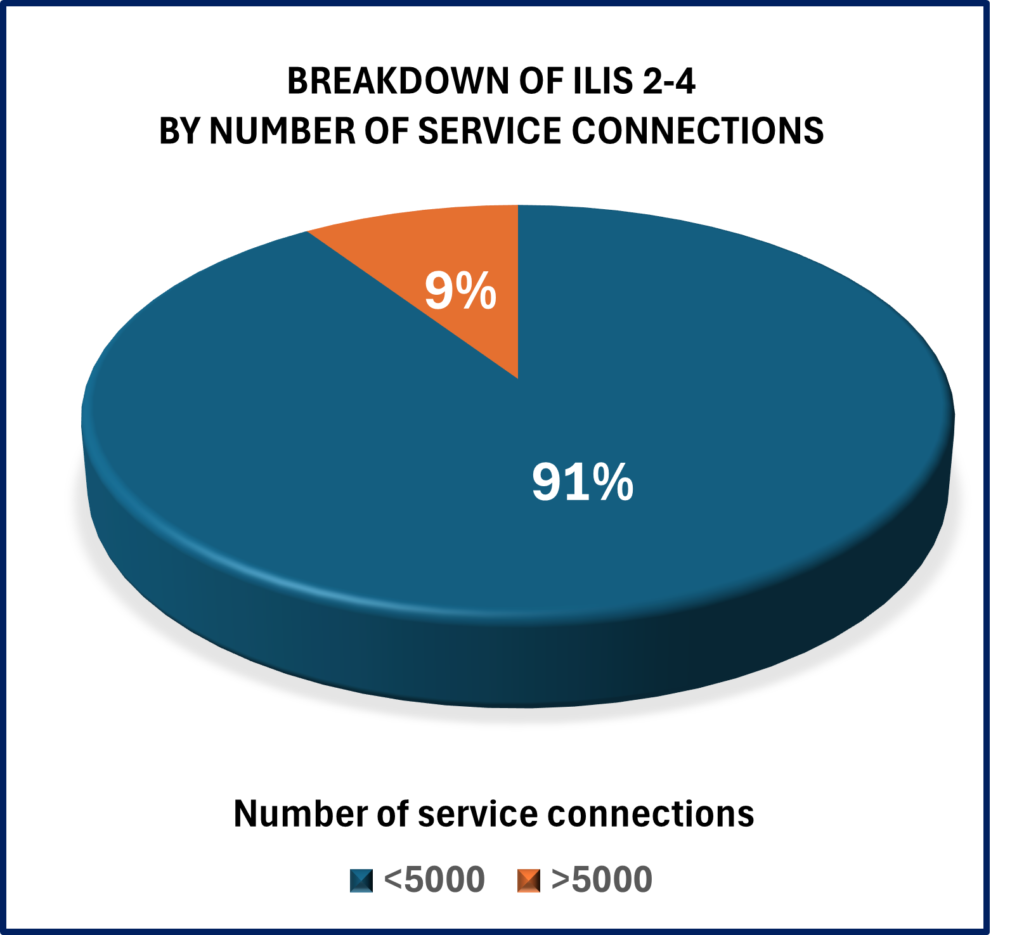
- In this ILI group, 91% of municipalities reporting ILIs 2-4 were small systems with <5000 service connections
- 9% of municipalities reporting ILIs of 2-4 had more than 5000 service connections
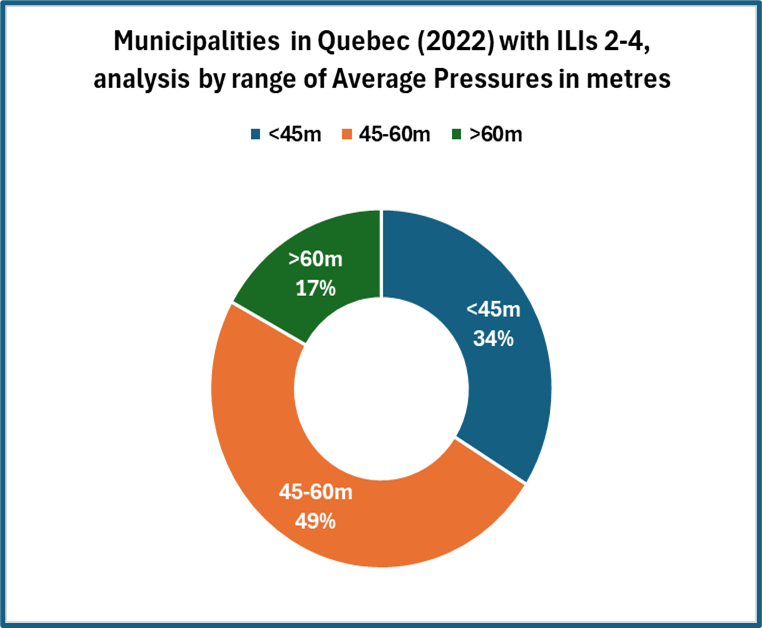
- Average Pressure ranged from 28-75 metres
- For this dataset, 34% of municipalities reporting ILIs 2-4 operate at Average Pressures below 45m, 49% between 45-60m and 17 % above 60m Average Pressure
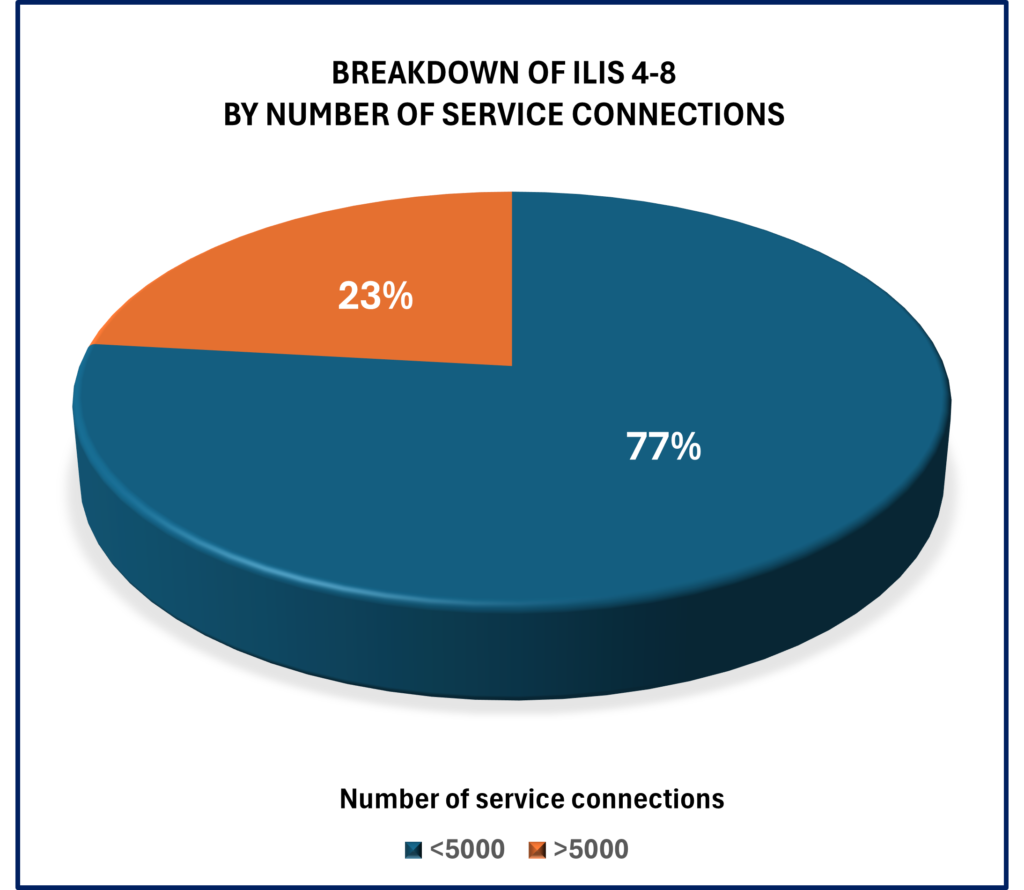
ILI and Average Pressures in LPCs C1 and C2 – ILI 4-8
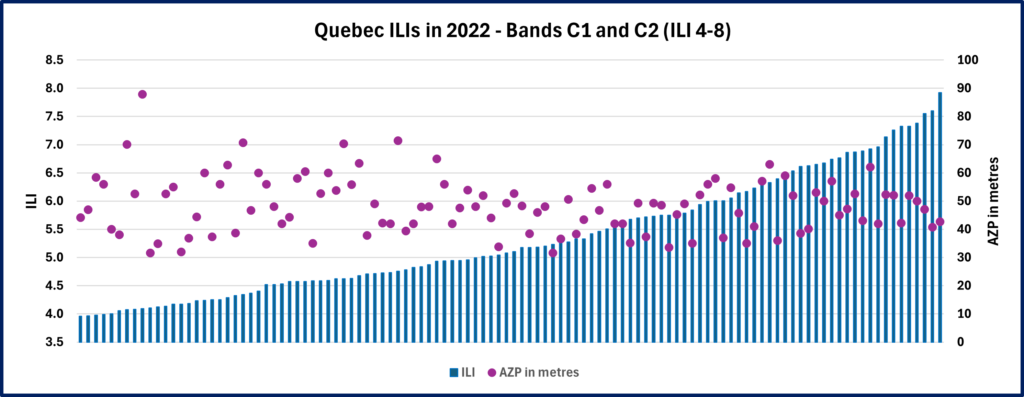
- 112 municipalities (14.2%) reported ILIs between 4-8
- Average Pressure ranged from 32-88 metres
- In this ILI group, system size ranges from 34- 40840 connections
- In this ILI group, 77% of municipalities reporting ILIs 4-8 were small systems with <5000 service connections
- 23% of municipalities reporting ILIs of 4-8 had more than 5000 service connections
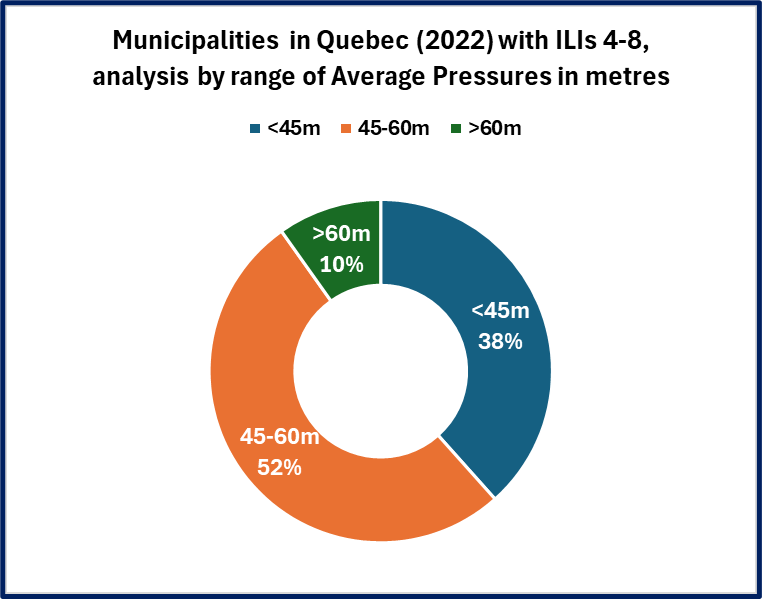
- Average Pressure ranged from 32-88 metres
- For this dataset, 38% of municipalities reporting ILIs 4-8 operate at Average Pressures below 45m, 52% between 45-60m and 10 % above 60m Average Pressure
ILI and Average Pressures in LPCs D1 and D2 – ILI>8.0
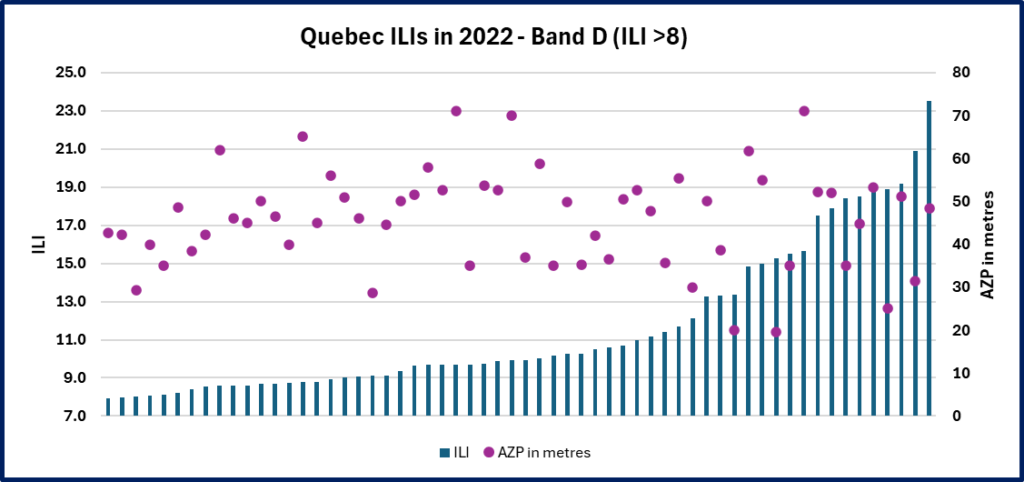
- 60 municipalities (7.7%) reported ILIs >8
- Average Pressure ranged from 20-71 metres
- In this ILI group, system size ranges from 32- 239000 connections
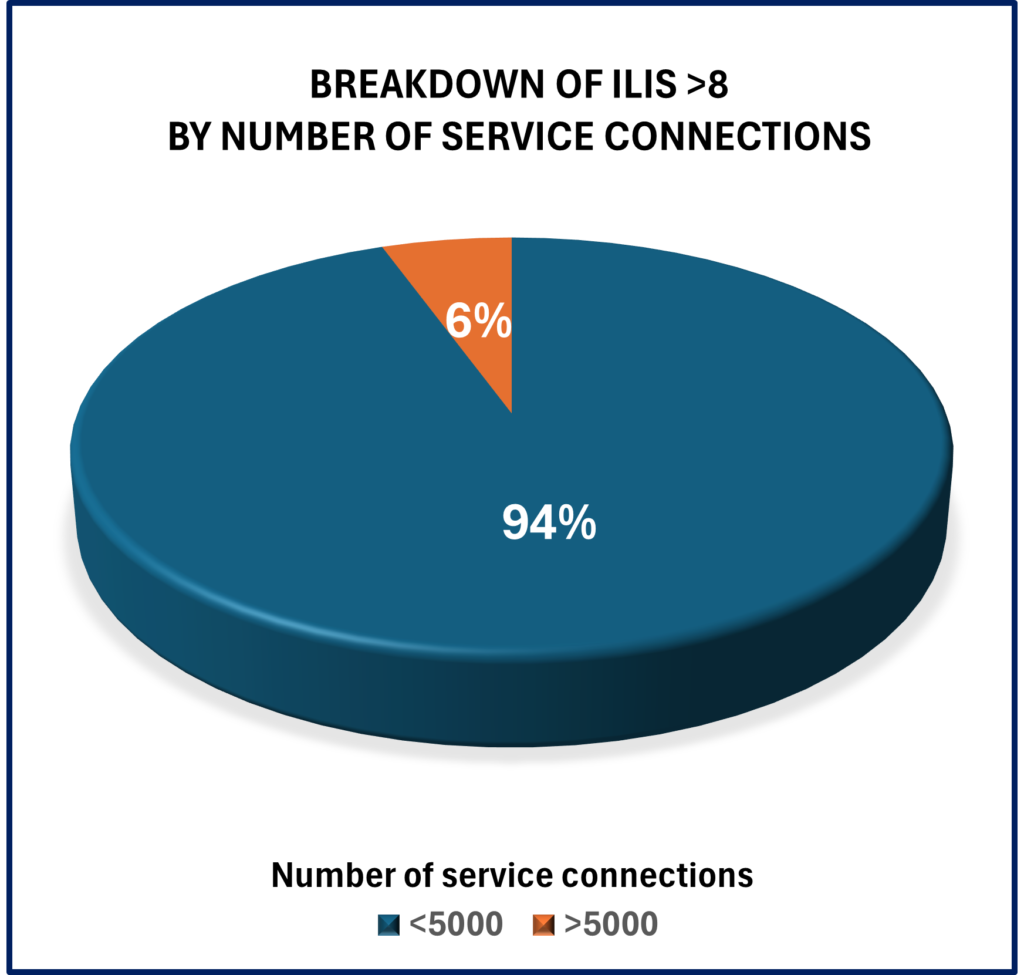
- In this ILI group, 94% of municipalities reporting ILIs >8 were small systems with <5000 service connections
- 6% of municipalities reporting ILIs of >8 had more than 5000 service connections
- Average Pressure ranged from 20-71 metres
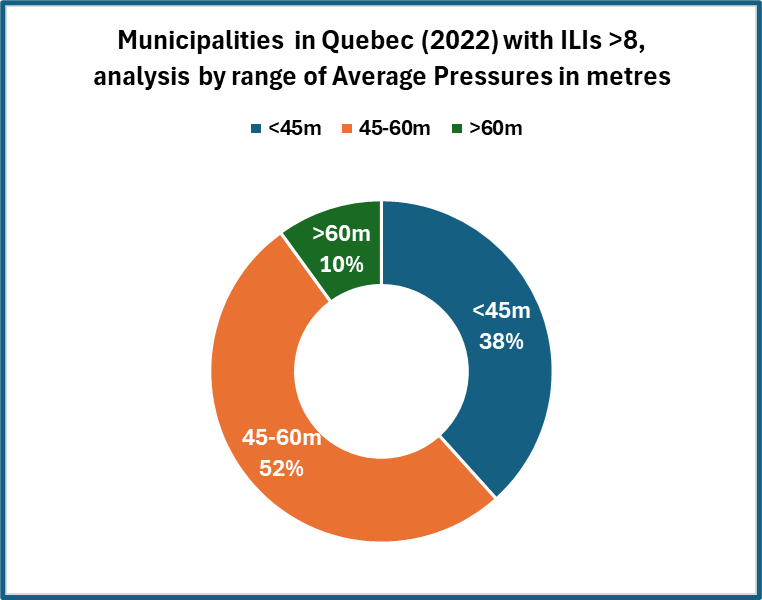
- For this dataset, 38% of municipalities reporting ILIs >8 operate at Average Pressures below 45m, 52% between 45-60m and 10 % above 60m Average Pressure
Summary Comments on ILI data and System Correction Factor calculations
The dataset reinforces our existing understanding that smaller lower pressure systems will usually have ILIs (based on UARL1999)of less than 1.0, due to lower median (rather than average) numbers of burst frequencies and reduced leak flow rates.
In 2021, the Quebec municipalities included in this ILI dataset for 2022, were included in a state-wide survey where UARL with SCF calculations were completed across 17 regions.
The following graphs show the summarised results of the SCF calculations –
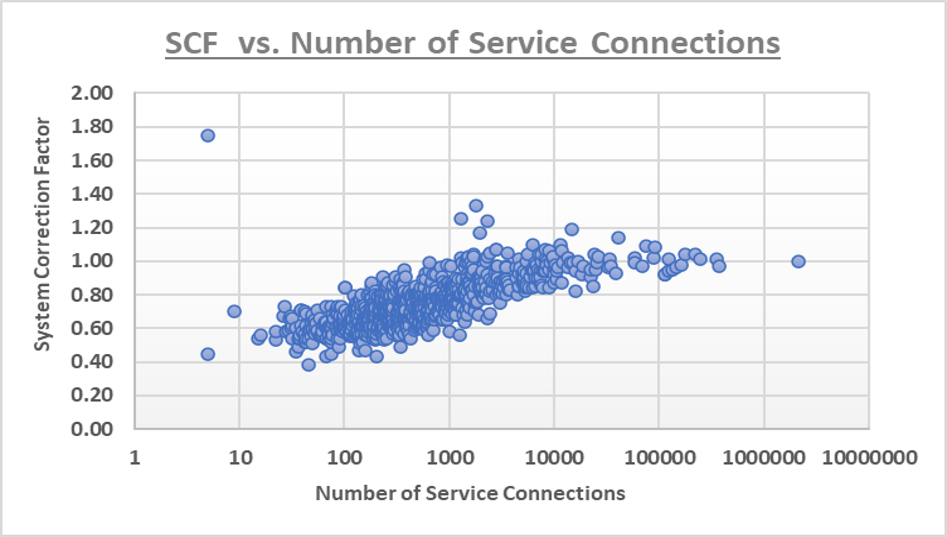
- An SCF=1.0 is equivalent to the standard 1999 UARL calculation.
- Therefore a value of SCF <1.0, typically seen in smaller, lower pressure systems, implies that the standard UARL1999 equation over-estimates UARL volumes.
- A value of SCF >1.0, typically seen in larger, higher pressure systems, implies that the standard UARL1999 equation under-estimates UARL volumes
- SCF calculations can be used for more customised UARL volume target setting
- As Average Zone Pressure increases, the value of SCF also increases
- For each individual system, SCF calculations also show how UARL volumes change if Average Zone Pressure is changed from its current value. Examples of this are shown on slide 10 in this presentation – https://www.wlranda.com/iwa-water-loss-2022-prague/
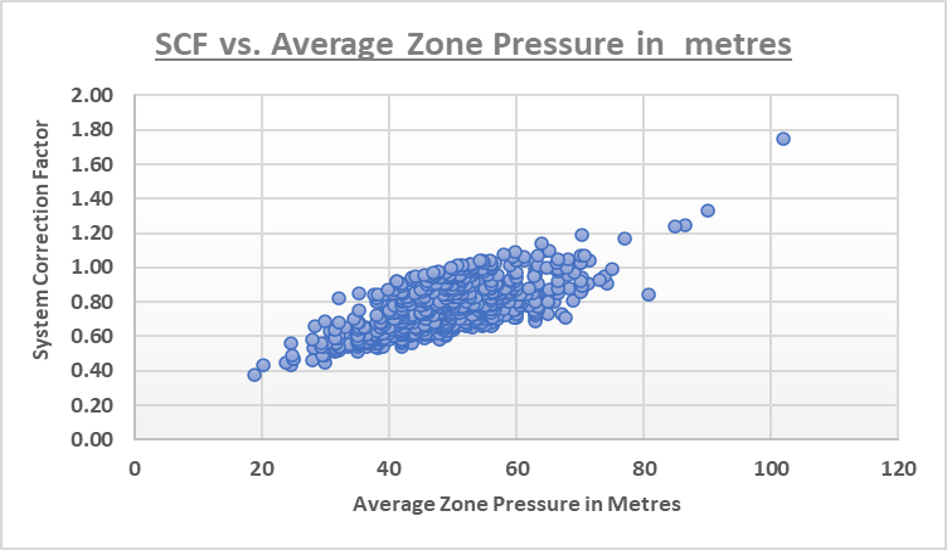
The value of the SCF is influenced by system size, density of connections, the proportion of rigid and flexible materials used on mains and services and Average Pressure. The first three of these factors are essentially fixed in the short to medium term. However, Average Zone Pressure can be reduced to a greater or lesser extent, to further reduce both leak flow rates and bursts. For this state-wide survey, SCFs at current operating pressures ranged from 0.38– 1.75, meaning that
For some zones or regions, the standard UARL1999 equation over-predicts UARL volumes by up to 62% – volume targets could therefore be set lower
For some zones or regions, the standard UARL1999 equation under-predicts UARL volumes by up to 75% – volume targets should therefore be set higher
The Quebec Water Efficiency Strategy team are using SCF calculations to have a better understanding of their systems and the way to reach their water loss objectives.
References
UARL with SCF is recognised in ISO Standard 24528 standard on Water Loss – https://www.iso.org/standard/59819.html
UARL with SCF is recognised and referenced in the AWWA Free Water Audit Software v.6 – https://www.awwa.org/Resources-Tools/Resource-Topics/Water-Loss-Control/Free-Water-Audit-Software
For more information on the SCF calculations for Quebec – https://www.wlranda.com/iwa-water-loss-2022-prague/