England & Wales Water Company Leakage Rises – or Falls?
Consumer Council for Water Report confuses interpretation of leakage statistics
Engineers and Scientists are often accused of failing to communicate effectively by using terms that are ‘hard to understand’ for media and the public. Some organisations and individuals believe they can simplify and improve the published message, but instead corrupt the output, by failing to recognise the difference between ‘evidence’ and ‘interpretation’. If, in public relations, ‘perception is reality’ then what responsibility should publishers of reports accept for confusing, rather than informing, on key issues?
It seems that everyone has an opinion on leakage in public water distribution systems. However, leakage volume expressed as a % of water put into supply is a flawed performance indicator. It is influenced by differences and changes in consumption, is easily manipulated, and is a ‘Zero-sum’ indicator. OFWAT, the England/Wales economic regulator, recommended strongly against its use in 1996, and this view has been repeatedly endorsed in many other countries and in professional reports since then. The recommended good practices for ‘Fit for Purpose’ performance indicators for leakage, from the recent evidence-based EU Reference document ‘Good Practices on Leakage Management (2015), summarised in Table 1, were endorsed in the most recent Policy Position Statement by the Chartered Institution of Water and Environmental Management CIWEM (2015).
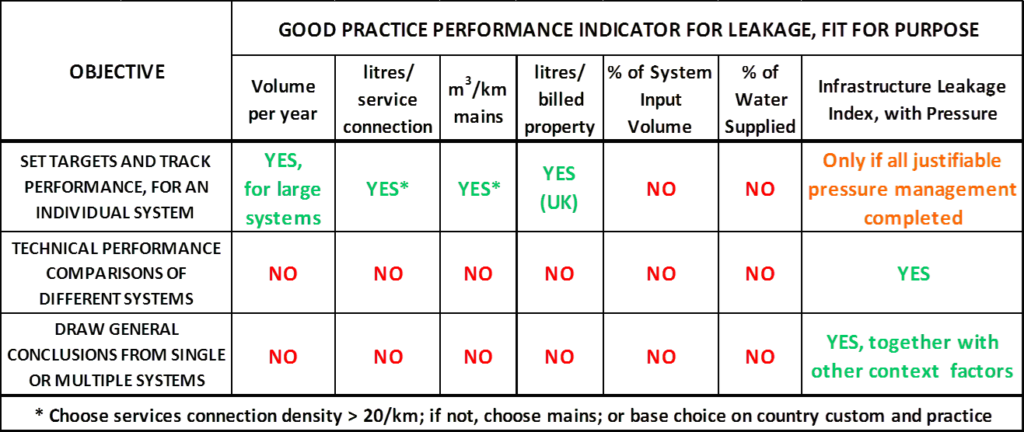
Table 1: Summary of Recommendations for ‘Fit for Purpose’ Leakage KPIs
Expressing leakage as a % of water put into supply has almost ceased in the past 20 years in the UK, but occasionally someone– in this case the Consumer Council for Water – decides to publish leakage statistics as %s of water put into supply with the laudable objective of trying to simplify the presentation of the data, but consequently (without realising it) confuses the issues.
The introduction to the CC Water Report states that data in the report ‘Delving into Water 2015 – Performance of the Water Companies in England & Wales 2010 to 2015’ are shown either ‘per 10,000 connections or as a percentage increase or decrease’. However, the percentages shown and mainly quoted in the ‘Leaks’ Section of the Report are leakage as % of water put into supply, which CC Water use both for tracking performance and comparing performance between Companies – both purposes clearly identified as unsuitable in Table 1. Fortunately, the CC Water Report also shows a Table of leakage in Megalitres/day, and publishes a separate Appendix with a Table of Water Put into Supply. A Table of Total Consumption can be derived by difference (see Tables 2a, 2b and 2c in the Analysis Appendix of this blog). Using this information, it is clearly demonstrated that:
- CC Water’s assumption that leakage expressed as a % of Distribution Input can be reliably used for tracking changes in leakage year-on-year, is not justified; it confuses rather than informs.
- The year-on-year % changes in leakage volume are always different and consistently and significantly more extreme than the % changes assessed using % of Distribution Input
- CC Water’s assumption fails even when used for a simple qualitative comparison of trends, if leakage volume rises, falls or remains the same, for one quarter of year on year annual trend calculations for both Company and National data.
- Leakage calculated as a % of Distribution Input, plus Consumption calculated as a % of Distribution Input, is a Zero-Sum calculation which must always equal 100%. This makes it impossible for leakage and consumption, as %s of Distribution Input, to both fall, or both rise, in the same year, which is clearly nonsensical when this can occur in reality.
A further blog, using CC Water England & Wales data and other statistics, will be posted on the LEAKSSuite website to show why leakage expressed as a % of Distribution Input should not be used for comparing technical performance of leakage management between Water Companies.
Problems with using % of Distribution Input in analysis of leakage statistics have already been informally drawn to CC Water’s attention. By demonstrating the real practical problems in such calculations, it is hoped that CC Water and others who may be tempted to use leakage as a % of DI for ‘simplification’ will recognise that this hinders, rather than helps, the objective of more rational analysis of leakage data, in the UK and elsewhere, and adopt ‘fit for purpose’ measures in Table 1.
In the UK, separation of Distribution Input into Total Leakage and Consumption requires a number of assumptions, due partly (but not wholly) to lack of 100% customer metering, and also to how leakage on customers’ private underground supply pipes is assessed. It is normal practice to calculate two estimates, one based on a ‘top-down’ water balance, the other derived mainly from analysis of ‘bottom-up’ night flow measurements and diurnal pressure variations.
In the UK, separation of Distribution Input into Total Leakage and Consumption requires a number of assumptions, due partly (but not wholly) to lack of 100% customer metering, and also to how leakage on customers’ private underground supply pipes is assessed. It is normal practice to calculate two estimates, one based on a ‘top-down’ water balance, the other derived mainly from analysis of ‘bottom-up’ night flow measurements and diurnal pressure variations. If the two calculations differ by less than 5% of Distribution Input, the difference is split between all components of the Water Balance, including Consumption, using a statistical process known as Maximum Likelihood estimation (MLE), to obtain a single published figure for Total Leakage each year. The resulting published Total Leakage each year is therefore subject to uncertainty somewhere within a range of 5% of Distribution Input, which is an additional reason to avoid commenting on year-on-year changes in Total Leakage as a % of Distribution Input.
All Distribution Input must become either a component of leakage or some form of consumption (whether it is authorised or unauthorised, metered or unmetered, billed or unbilled, or apparent losses). Therefore If Total Leakage volume has been assessed incorrectly as higher than the true figure, then Total Consumption volume must also have been assessed incorrectly as lower than the true figure by an equal volume. If Total Leakage volume has been assessed incorrectly as lower than the true figure, then Total Consumption volume must also have been assessed incorrectly as higher than the true figure by an equal volume. For tracking the overall effectiveness of water conservation (leakage control and consumption management), trends in annual Distribution Input volume (which is fully metered) are a meaningful measure (see Table 2a).
Allan Lambert
Appendix: Analysis of England & Wales data, 2010-11 to 2014-15
Tables 2a, 2b show data from the CC Water Report and Appendix; Table 2c is derived by difference
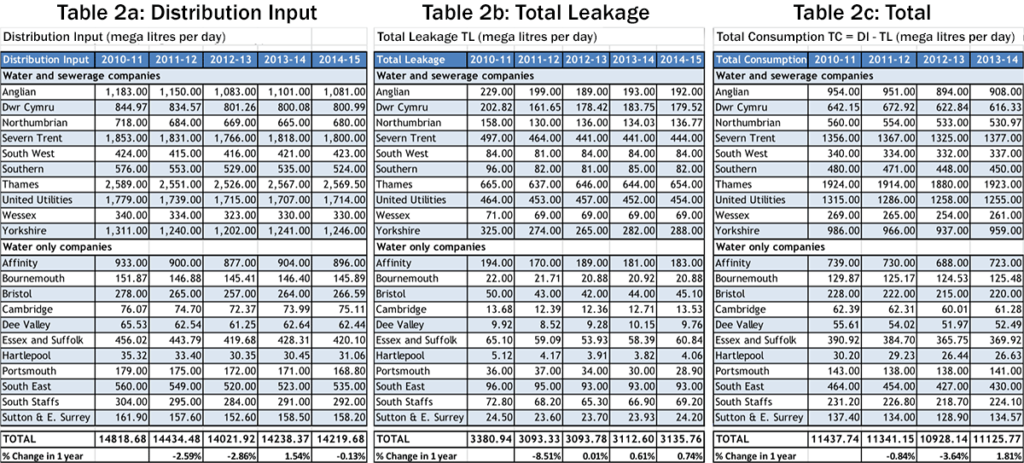
Source: Delving into Water 2015: Performance of the Water Companies in England & Wales 2010-11 to 2014-15
Table 3a, which represents CC Water’s assumption that Leakage as a % of Distribution Input can be used for meaningful tracking changes in leakage from year to year. Table 3a is compared below with Tables 3b (% change in Leakage volume) and Table 3c (Consumption as a % of Distribution Input).
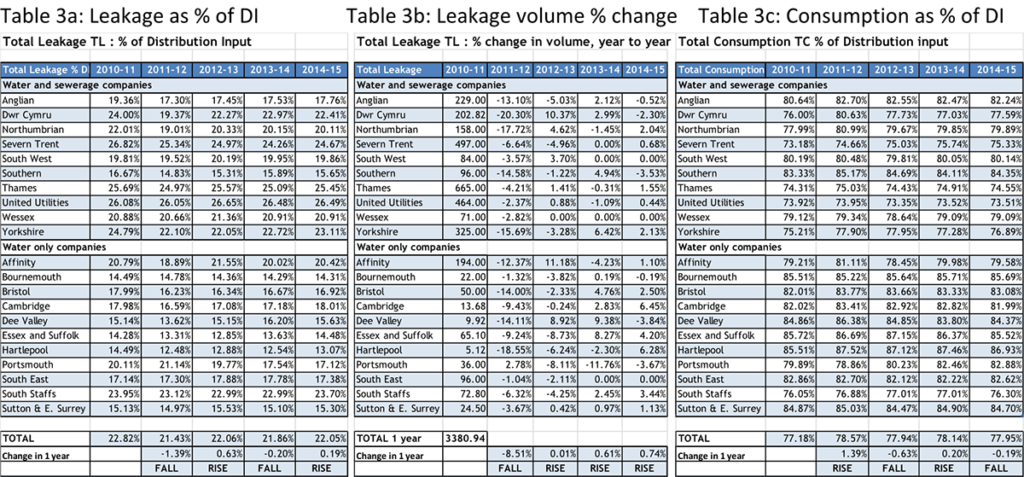
The bottom two lines of Tables 3a to 3c clearly show that using leakage as a % of Distribution Input to track year on year changes in leakage is a flawed assumption at National level because:
- year on year % changes in leakage volume (Table 3b) are significantly different, and greater, than the year-on-year changes in leakage as % of Distribution Input (Table 3a)
- year-on-year changes in leakage as a % of Distribution Input will not always correctly identify whether leakage volume rose or fell; see 2013-14 for example when leakage volume rose by 0.61% but leakage as a % of DI fell by 0.20%
- Year-on year changes in leakage as a % of Distribution Input (Table 3a), and consumption as a % of Distribution Input (Table 3c) always total 100%. If one rises, the other must fall, as this is a Zero-sum calculation (see Zero-Sum Leakage PI for more information on this topic).
A similar analysis was then carried out for each of the Water Company data sets to identify the number of occasions (in the years 2011-12 to 2014-15) when the use of leakage as a % of DI to track year-on-year trends in leakage would have produced the impression of a RISE or FALL or EQUAL leakage compared to the year before (Table 4a). This can then be compared with Table 4b, which considers year-on-year changes (RISE, FALL or EQUAL) in leakage volume, and Table 4c for consumption as a % of DI.
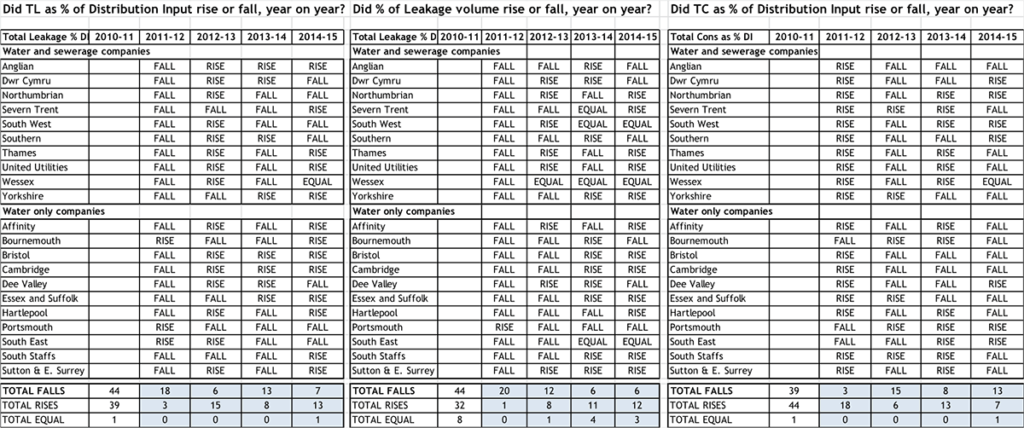
The bottom three lines of Tables 4a to 4c clearly show that using leakage % of Distribution Input to track year on year changes in leakage is also a flawed assumption at Water Company level in that:
- the 32 year on year rises in % change in leakage volume (Table 4b) are significantly less than the 39 year-on-year rises calculated using leakage as a % of DI (Table 4a)
- Year-on year changes in leakage as a % of DI (Table 4a) , and consumption as a % of DI (Table 4c) are always either opposites, or equal, as this is a Zero-sum calculation (see Zero-Sum Leakage PI for more information on this topic).
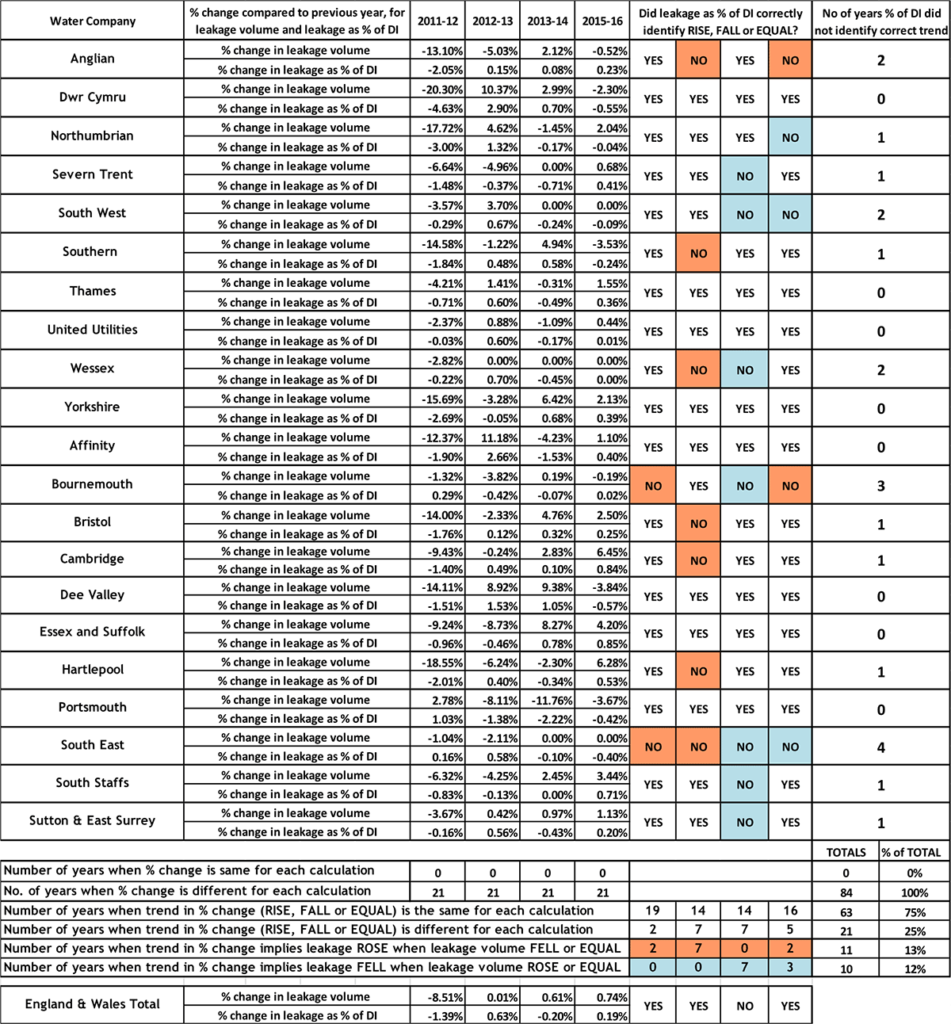
Table 5 shows the full comparison of the % changes, year or year, from 2011-12 to 2014-15, between % change in leakage volume, and % change in leakage expressed as a % of distribution input, for each of the 21 Water Companies. The following conclusions are clearly identified from the 84 data sets:
- There were zero occasions when % change in leakage as a % of Distribution Input correctly reflected % change in leakage volume. In fact, % changes in leakage volume were much larger.
- Even if % change in leakage as % of Distribution Input is only used to indicate trends in leakage volume year to year (RISE, FALL or EQUAL), Water Company trends in leakage volume would be incorrectly assessed 21 times out of 84, or 25% of the time.
- 11 of these 21 incorrect assessments implied that leakage ROSE, when leakage volume actually FELL or was EQUAL compared to the previous year
- 10 out of these 21 incorrect assessments implied that leakage FELL, when leakage volume actually ROSE or was EQUAL compared to the previous year
- Trends in 13 out of the 21 Companies would have been wrongly assessed between once and four times in the 4-year period.
Table 5: Comparison of % changes in leakage volume, and change in leakage % of Distribution Input, for Water Companies
