
2022/2023 ILI data for Australia
The information in this Webpage was obtained from the National performance report 2022-23: urban water utilities published by the Australian Government Bureau of Meteorology; at http://www.bom.gov.au/water/npr/ with information provided by utilities across Australia’s states and territories. The Reports name and identify each individual Water Service Provider (WSP), a practice which sets an excellent example to some other countries which do not currently identify individual Utilities.
Frequency of audits by suitably qualified and experienced auditors are generally carried out at a minimum of 3-year intervals (varying state-by-state) and assigned Levels of Assurance are generally ‘reasonable’ or in some instances ‘limited’ as appropriate. WSAA Guidance in their Water Balance software at the end of the millennium drought 2001-11 recommended that ILIs less than 0.7 should always be double checked for possible calculation errors. It is not known if this double check has been carried out on the 2022/23 data. Customer meters in Australia are located at the property line (close to the edge of the street).
Trends in Real Losses in Litres/connection/day in Australia
Section 7.3 of Part A of the National Performance Report includes analysis of trends in litres/service connection/day for 69 Utilities, with values ranging from 0.1 (in ‘multiple Utilities’ ) to 416 litres/connection/day. Year on year increases were noted in 39 Utilities and decreases in 30 Utilities. Section 7.3 comments that ‘performance of this indicator may be influenced by the condition of mains, infrastructure and water pressure’ . However, no mention is made of the influence of density of connections per km of mains (although it is calculated as an indicator) or the condition and burst frequency of service connections (mains to meter) which can be a significant component of real losses.
Infrastructure Leakage Index
In the 2014-2015 ILIs data set previously presented on LEAKSSuite Library, the average pressures (used to calculate Unavoidable Annual Real Losses and then ILI) were known and shown, and ranged from 20 to 70 metres. Density of connections ranged from 5.5 to 63 per km of mains (median 35). These wide ranges have a major influence on real losses of individual Utilities when expressed in litres/connection/day (or kl/km of mains/day), which is why the UARL and the ILI KPI takes them into account, using relationships which were widely tested using Australian data in the 2008-2011 WSAA Asset Management Project PPS-3 Review of Water Leakage and Management Practices.
Water pressure significantly influences leak flow rates and burst frequency on mains and services. Background (undetectable) leakage (which accounts for more than half the annual volume of leakage in most Australian Utilities) is very sensitive to pressure. Extensive installation of many hundreds of additional Pressure Reducing Valves, targeted to reduce leak flow rates and burst frequencies on mains and service connections, played a clearly demonstrated major part in management and reduction of leakage and bursts in Australia during the latter part of the millennium drought. Then analysis of that data in 2011 to 2013 produced a predictive pressure: burst frequency model which has been successfully used in Australia and other countries (for example South Africa and UK) to target zones for burst reduction by pressure management, which greatly improves the economic case for selective pressure management.
Quality control and interpretation of the Australian water loss data can be significantly enhanced if the average pressures used by each Utility are also published with ILI data, as in American Water Works Association (AWWA) Water Audit software. However, where pressures are not published, Water Loss Research and Analysis Ltd have developed a methodology for calculating implied average pressures from the published values for litres/connection/day, m3/km mains/day and ILI. As these published ILI values are rounded to the nearest 0.1, we have not yet quoted them here but the authors will ask WSAA if the average pressures actually used can be kindly provided to test the methodology. Initial checks using this method suggests the presence of a few anomalous results, which have been omitted from the data set presented below.
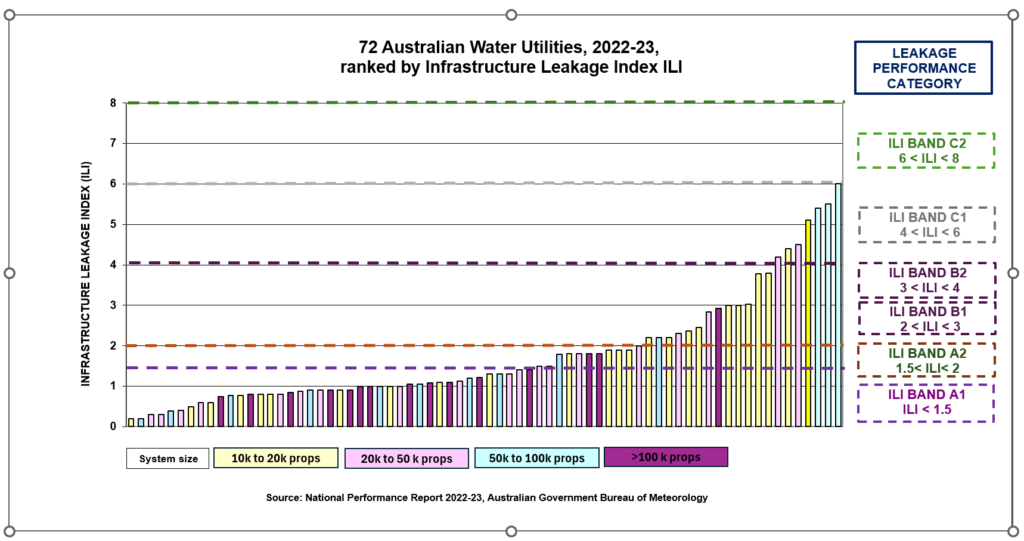
The calculated ILIs for 2022-23 for 72 WSPs are shown in the chart below, classified by number of properties (minimum 10,000). ILIs have been classified using international Leakage Performance Categories A1 to C2 (Liemberger) shown at the right hand side of the graph, see ‘UARL and ILI‘ section of the LeaksSuite Library.
When interpreting the above ILI data, remember that real losses volumes from Water Balances (and therefore all real losses KPIs) have levels of uncertainty. In Australia these may include ‘meter lag’ errors, as some Australian State regulators may require that the water balance calculation is made using estimated customer consumption for some customer meters which may not be read until several months after the last day of the ‘water year’.
In 2022/23, 72% of WSPs, including 14 of the largest Utilities with more than 100k properties, achieved ILIs of 2.0 or less, within Leakage Performance Category (LPC) ‘Low’ Band A , implying that further loss reduction may be uneconomic unless there are shortages. Also 60% of the WSPs have achieved ‘Very Low’ ILIs of 1.5 or less, which is an excellent performance by international standards. Of the 9 Utilities reporting less than 0.7, these values could be checked in more detail if the average pressures can be confirmed.
Discussion
There will be many countries which would wish to be pleased to be able to report the very large reductions in leakage and low ILIs which have been achieved in Australia since the IWA methodology was adopted by WSAA in 2003. Although the average system pressure is not quoted in the published NPR data, the values can now be back-calculated. Many people still fail to understand that average water pressure is a fundamental key parameter for leakage specialists to interpret leakage and bursts data, just as meteorologists create and need synoptic charts of air pressure isobars to interpret weather data.
The Australian ILI data set, with so many ILIs close to 1.0, despite the wide diversity in the above key system characteristics, strongly supports the general validity of the UARL equation, which was first published in 1999 to predict ‘how low could you go?’ ten years before such low leakage levels were being achieved in Australia, towards the end of the Millennium drought, and elsewhere. In a limited set of circumstances the calculated real losses may be less than the UARL (resulting in ILIs less than 1) but such situations can now be predicted using UARL with System Correction Factor (SCF) software for very small systems (less than 5000 service connections) and/or average pressures outside the 45 to 60 metres range
In Australian National Performance Reports, litres/service connection/day is the main KPI currently used for both tracking and comparing leakage management performance of Australian WSPs. A 2016 EU Reference Document ‘Good Practices on Leakage Management’ confirmed that litres/connection/day is recommended for tracking performance in individual systems. However, it also confirmed that ILI – not litres/service connection/day – should be used for technical performance comparisons between different systems because of widely different key characteristics (density of connections, length of service connections main to meter, and average pressure).
The Global ILIs section of the LeaksSuite website is pleased to provide a forum where the excellent leakage management performance of the Australian WSPs can be compared on a level playing field with other leaders in leakage management.
Countries or Regions which already have sufficient ILI data to justify a separate entry within Global ILIs are also invited to contact us at info@leakssuitelibrary.com
Kate Stanton-Davies and Allan Lambert 28th August 2024
Comments and feedback to this note is invited to info@leakssuitelibrary.com and if any errors or misassumptions are identified they will then be corrected.